Loading...
H420 · PAG6; 2.1.2, 5.2.1, 6.1.3Practical Activity GroupsCore
PAG6: Chromatography or Electrophoresis
Use the centre’s approved leaf-extraction and chromatography procedure, with the specified solvent and handling arrangements. Compare suitable leaves and apply comparable extracts to a marked origin, allowing appropriately concentrated small applications rather than a large spreading patch.
Before you start
- Recall stationary/mobile phases and measure distances from a common origin.
- OCR practical activity groups describe skills and techniques; centres may use suitable alternative activities. The examples here support understanding and supervised evidence, rather than prescribing every experiment shown.
- Prepare for teacher-approved laboratory work. Follow the laboratory risk assessment, handling, heating and disposal instructions. Written study and quiz results do not certify supervised Practical Endorsement evidence.
Watch, pause, try
Video by Bio-Rad Explorer. The demonstration shows agarose-gel electrophoresis. The written lesson also teaches pigment chromatography as the alternative technique in this group.
Viewing focus: Explain the chosen biological separation mechanism
After watching, attempt these questions before opening the answers. You can also use the written lesson below.
After watching 1: What information does a DNA ladder provide?
Show answer and reasoning
Known fragment sizes measured under the same run conditions, supporting a size comparison with unknown bands.
After watching 2: Why is one matching band insufficient for a unique identity?
Show answer and reasoning
Different samples can share a fragment size, and the method has limited resolution. More independent loci and other evidence strengthen the comparison.
What you'll be able to do
- Explain the chosen biological separation mechanism
- Calculate migration ratios or use a fragment-size calibration
- Evaluate component identity and comparison limits
1
Prepare a controlled comparison
Use the centre’s approved leaf-extraction and chromatography procedure, with the specified solvent and handling arrangements. Compare suitable leaves and apply comparable extracts to a marked origin, allowing appropriately concentrated small applications rather than a large spreading patch.
The origin must begin above the solvent level so the applied extract is not simply washed into the reservoir. Use a suitable pencil mark rather than soluble ink. Keep the same stationary material, solvent system and development conditions across samples; these affect separation and the resulting pattern.
2
Explain separation and calculate Rf
As solvent moves, pigment molecules partition differently between the stationary phase and moving phase. Differences in solubility and attraction lead components to travel different distances. A separated colour band is evidence of a component under those conditions, not automatically proof of its identity.
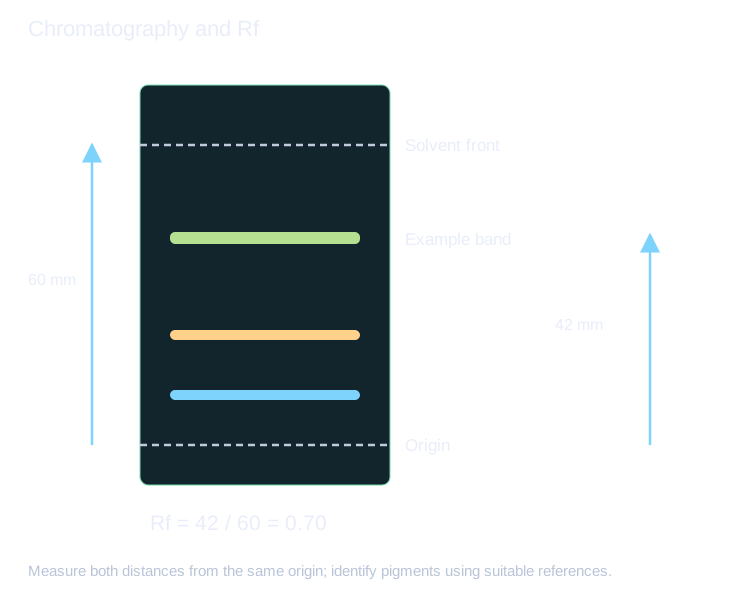
Mark the solvent front promptly and measure from the origin to the centre of the pigment band and from the origin to the solvent front. Rf is the first distance divided by the second, so it has no unit. A valid band cannot have travelled farther than the recorded solvent front in the same run.
3
Interpret leaf differences and method limits
Compare band position and colour with suitable known references under matching conditions. Similar Rf values alone do not prove that two compounds are identical. Diffuse or overlapping bands make centres and component counts uncertain, while different extract concentrations can alter band intensity.
Differences between shade-tolerant and other leaves may suggest different pigment complements or relative amounts, but chromatography alone does not directly measure photosynthetic rate. Control leaf source, extraction efficiency and loading before attributing a darker band only to greater biological pigment abundance. Use independent samples and record limitations.
4
Separate DNA fragments using an electric field
DNA’s phosphate backbone gives it a negative charge, so fragments move toward the positive electrode in an appropriately set up gel. Under comparable agarose conditions, smaller fragments generally migrate farther than larger ones. A reference ladder contains known fragment sizes; compare it on the same gel rather than assigning a size from distance alone.
Use the laboratory’s approved loading, electrical and staining arrangements. A tracking dye is not necessarily a DNA band. Gel composition, voltage, run time and detection affect the pattern, and equal band positions do not uniquely prove identity. A suitable multi-locus comparison and other evidence are needed for a strong identification claim.
5
Select the separation model that matches the material
Pigment chromatography depends on relative interactions with stationary and mobile phases. DNA electrophoresis uses charge-driven movement through a matrix. Both separate components, but a chromatography Rf value is not a universal DNA fragment-size conversion. Electrophoretic size estimates often use a local relation between log fragment size and migration distance when that calibration is justified.
This group permits chromatography or electrophoresis. The examples explain both so you can identify the method needed for an unfamiliar question; the centre maps the actual chosen activities to required technique evidence.
6
Apply the biology
Try each question before opening the worked response. Use precise biological terms, connect each cause to its effect, and check units and assumptions when interpreting data.
Example 1A pigment travels 42 mm and the solvent front 60 mm from the origin. Find Rf.
1Rf=42/60=0.70.
2Both distances use the same origin and units.
Answer0.70, with no unit.
Example 2Two leaves produce bands with the same colour and similar Rf. Is identity proven?
1The pattern is consistent with a similar pigment under the run conditions.
2Different compounds can sometimes have similar migration.
3A reference and further evidence strengthen identification.
AnswerSimilarity supports but does not uniquely establish identity.
Example 3A ladder calibration is approximately linear in log₁₀(size) between 1000 bp at 20 mm and 500 bp at 40 mm. Estimate a band at 30 mm.
130 mm is halfway between the distances, so use the midpoint of the logarithms.
2The corresponding size is √(1000 × 500), not the arithmetic midpoint.
AnswerApproximately 707 bp under the stated local log-linear calibration.
Common mistakes to avoid
Measuring pigment and solvent distances from different baselines.
Use the same origin.
Calling an Rf match definitive chemical identification.
Use references and recognise method limits.
Key takeaways
- You can explain the chosen biological separation mechanism.
- You can calculate migration ratios or use a fragment-size calibration.
- You can evaluate component identity and comparison limits.
Apply it in an exam
Question 1: Two leaves produce bands with the same colour and similar Rf. Is identity proven?
Show answer and reasoning
Similarity supports but does not uniquely establish identity.
- The pattern is consistent with a similar pigment under the run conditions.
- Different compounds can sometimes have similar migration.
- A reference and further evidence strengthen identification.
Explore further
- OCR H420 official specification (opens in a new tab)
Check the assessed scope and practical or mathematical requirements.
- Read or explore this topic (opens in a new tab)
An external explanation or interactive activity to use alongside the lesson. It may include extension material.
Return to this tomorrow
Close the notes and answer from memory. Revisit any explanation you cannot yet reconstruct.
- An apparent Rf above 1 suggests:
- Darker bands can be affected by:
Test yourself
Answer a few questions, then review anything you missed.
Next step
Browse practice topicsKeep practising
Start with the quiz above to check the key ideas. You can also choose another topic from the practice library.