Loading...
1BI0 · CP1.16Core practical investigationsCore
CP1.16: Potato Osmosis
Prepare the specified concentration series and equal comparable plant-tissue pieces. Record the initial mass of each piece, expose it to a defined solution for the same interval, and measure the final mass using the approved method. Keep tissue source, dimensions, solution volume and temperature comparable.
Before you start
- Use your teacher’s tier checklist: this overview can include Higher-only material, and is not a tier-specific revision list.
- Pearson Edexcel GCSE Biology 1BI0 core-practical preparation. Use the actual specification reference rather than another board’s practical number.
- Explain net water movement through a partially permeable membrane.
- Use the centre’s approved practical method, supervision and safety arrangements. Written preparation and quiz results do not replace carrying out and recording the required practical work.
Watch, pause, try
Video by Malmesbury Education. The demonstration is labelled A-level. Use it for the shared tissue-preparation and weighing methods; this GCSE guide focuses on controlled concentrations, percentage mass change and interpretation.
Viewing focus: Design a controlled solution-concentration comparison
After watching, attempt these questions before opening the answers. You can also use the written lesson below.
After watching 1: Why blot consistently before weighing?
Show answer and reasoning
To reduce the contribution of surface solution. The mass should primarily represent the tissue.
After watching 2: What is the denominator in percentage mass change?
Show answer and reasoning
Initial mass. Relative change is based on the starting value.
What you'll be able to do
- Design a controlled solution-concentration comparison
- Calculate percentage mass change
- Interpret a zero-change estimate and its limitations
1
Make concentration the intended difference
Prepare the specified concentration series and equal comparable plant-tissue pieces. Record the initial mass of each piece, expose it to a defined solution for the same interval, and measure the final mass using the approved method. Keep tissue source, dimensions, solution volume and temperature comparable.
The pieces must be immersed consistently, and the starting solution should not be changed substantially by the tissue itself. Use appropriate independent pieces at each concentration. Several readings of one piece check weighing consistency but do not replace separate biological samples.
Pearson CP1.16 specifies potato in sucrose solutions, with known starting and final masses used to obtain percentage mass change. The zero-change solution is an external comparison under the tissue’s conditions, not an exact assay of every intracellular solute.
2
Measure tissue rather than surface liquid
Use a consistent gentle blotting method before weighing so liquid on the outside does not dominate the apparent change. Do not squeeze water from the tissue or leave it drying for different intervals. Record raw initial and final masses with the balance’s supported precision.
Percentage mass change = (final − initial mass) ÷ initial mass × 100. Positive values indicate gain and negative values loss. Percentage change allows fairer comparison when initial masses differ, but it does not remove every effect of unequal dimensions or preparation.
3
Interpret the response curve
Plot concentration against percentage mass change with suitable axes and use a justified best-fit relationship. An estimated zero-change point identifies an external solution producing no net measured mass change under those conditions. Interpolation between measured points is more defensible than extrapolating far outside the range.
Osmosis explains net water movement across partially permeable membranes. A zero final change does not mean individual water molecules stopped moving, nor does it give the exact concentration of every solute inside every cell. Tissue variation, equilibration time and measurement uncertainty limit the inference.
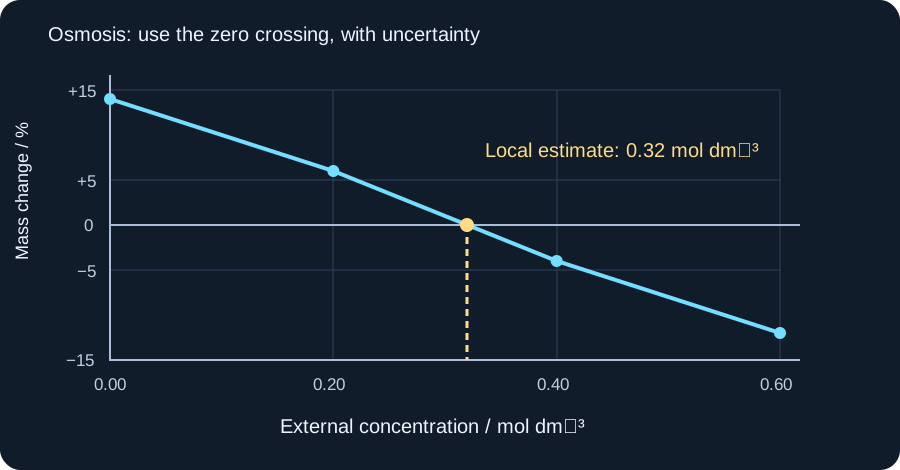
| External concentration / mol dm⁻³ | Mean mass change / % |
|---|---|
| 0.00 | +14 |
| 0.20 | +6 |
| 0.40 | −4 |
| 0.60 | −12 |
4
Worked applications
Attempt these problems on paper before opening the worked reasoning. Explain your steps as well as giving a final answer.
Example 1A piece changes from 2.50 g to 2.25 g. Calculate percentage mass change.
1Change = −0.25 g.
2−0.25/2.50 × 100.
Answer−10.0%.
Example 2Mean changes are +6% at 0.20 mol dm⁻³ and −4% at 0.40 mol dm⁻³. Estimate the zero-change concentration assuming a straight relationship locally.
1Zero is 6/10 of the way across the 0.20 mol dm⁻³ interval.
20.20 + 0.6 × 0.20 = 0.32.
AnswerAbout 0.32 mol dm⁻³; it is a local interpolation.
Common mistakes to avoid
Dropping the negative sign on a mass loss.
Use final minus initial.
Calling one interpolated concentration exact.
State the local model and measurement limits.
Key takeaways
- You can design a controlled solution-concentration comparison.
- You can calculate percentage mass change.
- You can interpret a zero-change estimate and its limitations.
Apply it in an exam
Question 1: Mean changes are +6% at 0.20 mol dm⁻³ and −4% at 0.40 mol dm⁻³. Estimate the zero-change concentration assuming a straight relationship locally.
Show answer and reasoning
About 0.32 mol dm⁻³; it is a local interpolation.
- Zero is 6/10 of the way across the 0.20 mol dm⁻³ interval.
- 0.20 + 0.6 × 0.20 = 0.32.
Explore further
- Edexcel 1BI0 official specification (opens in a new tab)
Check the assessed scope and practical or mathematical requirements.
- Read or explore this topic (opens in a new tab)
An external explanation or interactive activity to use alongside the lesson. It may include extension material.
Return to this tomorrow
Close the notes and answer from memory. Revisit any explanation you cannot yet reconstruct.
- What is the denominator in percentage mass change?
- Does zero measured mass change mean water molecules are stationary?
Test yourself
Answer a few questions, then review anything you missed.
Next step
Browse practice topicsKeep practising
Start with the quiz above to check the key ideas. You can also choose another topic from the practice library.